



A 12-week SCM CHAMPS implementation of Predictive Labor Demand Planning (pLDP) on SAP S/4HANA Cloud Private Edition
At a Glance
| Field | Detail |
| Client | E-commerce & third-party logistics (3PL) fulfilment provider, Belgium (name withheld under NDA) |
| Scale | ~350,000 sq ft distribution center · ~450 associates across two shifts · 45,000+ order lines per day |
| Solution | SAP EWM Predictive Labor Demand Planning (pLDP) on SAP S/4HANA Cloud Private Edition 2025 FPS01 |
| Partner | SCM CHAMPS — SAP supply chain execution specialists (EWM, TM, warehouse digitalization) |
| Engagement | 12 weeks, delivered end-to-end — advisory, configuration, ML enablement, analytics, training, hypercare |
| Headline results | ~18% less unplanned overtime · weekly planning effort ~6 hrs → under 1 hr · order lines per labor hour up ~11% |
Executive Summary
Every Sunday evening, the operations manager at the client’s main distribution center opened a spreadsheet and tried to answer one question that sounds simple until you actually have to answer it: how many people do we need on the floor next week?
Overestimate, and workers stood around while labor costs crept up. Underestimate, and orders missed their cut-offs, overtime spiked, and promises to customers slipped. For years the answer came down to experience, a glance at last year’s numbers, and a fair bit of hope that it would hold.
SCM CHAMPS set out to fix that. As the end-to-end implementation partner, it deployed Predictive Labor Demand Planning (pLDP) — the machine-learning capability built directly into SAP EWM on SAP S/4HANA Cloud — so the client could forecast short-term labor demand automatically. The forecasts run entirely off the warehouse’s own historical Radio Frequency (RF) execution data from picking, packing, and staging. Critically for IT leaders, it was built entirely on SAP standard functionality — no custom development, no external tooling, and no data-science hire.
Within the first quarter after go-live, the picture had changed. Staffing shifted from reactive, spreadsheet-driven guesswork to a steadier, data-led routine. Weekly planning effort dropped from about six hours to under one. Unplanned overtime fell by an estimated 18%. On-time outbound dispatch held up better through the peaks — and it happened without the cost of building Engineered Labor Standards (ELS) or standing up a data-science team.
“For the first time, Monday’s staffing plan is built on evidence instead of instinct. That one change has paid for the project several times over.”
— Head of Warehouse Operations, client organization
The Challenge
During the very first discovery workshop, the client’s Head of Warehouse Operations captured the problem in a single line that became the project’s unofficial motto: “We always find out how busy we were — never how busy we’re going to be.”
Underneath that sentence sat four concrete failures of the old way of planning:
- Manual, backward-looking planning. Shift supervisors set headcount from last week’s throughput and personal intuition. There was no systematic forecast of upcoming workload at all.
- Over- and understaffing — often in the same week. Quiet Mondays left labor idle; peak Thursdays meant pickers pulled from other zones, rushed packing, and overtime approvals signed off at the last minute.
- No practical path to Engineered Labor Standards. SAP EWM Labor Management can run on ELS, but building and maintaining those standards costs real time and money — capacity the client didn’t have to spare across every activity area.
- Zero forward visibility for stakeholders. Managers had ample reporting on what had already happened, but nothing on their screens answered the question that mattered: how many Full-Time Equivalents (FTEs) will we need next Tuesday, and how much volume should we expect to move?
The gap carried a real cost. Overtime spend kept climbing, service levels wobbled through the peaks, and supervisors lost hours every week wrestling with spreadsheets that were out of date the moment demand shifted.
How pLDP Works, in Plain Terms
Before the solution detail, here is the whole pipeline at a glance — from the warehouse’s own history to a published shift plan:
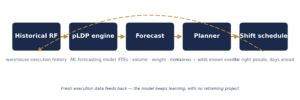
Step by step:
| The pLDP Forecast Loop
Inputs → The warehouse’s own historical RF execution records from picking, packing, and staging (workload durations and confirmations), plus the factory calendar. Model → SAP’s embedded triple exponential smoothing — a seasonal time-series method — running inside Intelligent Scenario Lifecycle Management (ISLM) on the Predictive Analysis Library (PAL). It retrains itself continuously on fresh execution data. Output → A rolling forecast, by activity area, of workload duration, calculated FTEs, expected weight, volume, and item counts — covering the next operating days and the week ahead. Action → Planners review the forecast in SAP Fiori and Smart Business, layer on known events (a promotion, a new client going live), and set the shift plan with days of lead time. |
The important part for a decision-maker: the model learns from work the warehouse is already doing. There is no separate data pipeline to build and no ongoing modelling project — once it’s switched on, it keeps teaching itself.
The Solution: AI Built Into the Execution System
SCM CHAMPS designed the solution around SAP’s standard pLDP architecture, deliberately avoiding custom development wherever the standard could do the job. Three elements did the work.
- Machine-learning workload forecasts
pLDP is built on SAP’s embedded time-series forecasting, which learns from the workload records that picking, packing, and staging leave behind every time they’re executed on RF. SCM CHAMPS insisted on at least three weeks of clean historical RF data before the first productive run — comfortably above SAP’s documented two-week minimum — so the model could pick up the warehouse’s weekday patterns and volume rhythms from day one.
- Fiori dashboards and SAP Smart Business analytics
A forecast only earns its keep if planners can see it and believe it. SCM CHAMPS activated the Labor Demand Planning interface and the Smart Business dashboards, giving planners a clear visual of planned versus forecasted workload with drill-down by activity area — duration, calculated FTEs, weight, volume, and item counts. Because the system was on the 2025 FPS01 feature pack, the team also surfaced pLDP statistics as configurable KPI cards in the Warehouse KPIs app, giving management an at-a-glance view with one-click navigation into the detail.
- Graceful coexistence with Labor Management
A key design point: pLDP does not require classical Labor Management or ELS to be in place. Historical workload records drive the forecast today, while the door stays open for engineered standards later. SAP’s standard logic handles this cleanly — any activity area with ELS values maintained is governed by those standards, while every other area keeps drawing on the machine-learning forecast. The client gets AI-driven planning now, without foreclosing a more engineered approach later.
Implementation: 12 Weeks, Five Phases
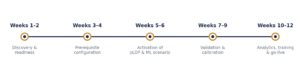
Phase 1 · Discovery & system readiness (Weeks 1–2)
Discovery workshops with operations; mapped the outbound flow from outbound delivery order creation through wave release, RF picking, packing, and staging; verified pLDP prerequisites on 2025 FPS01, including a walkthrough of SAP’s central reference note (SAP Note 3577311). A weekly steering checkpoint with the operations head and IT lead was established here and ran unbroken through go-live.
Phase 2 · Prerequisite configuration (Weeks 3–4)
Confirmed the RF framework was live for picking, packing, and staging; verified that every storage bin in the packing and staging zones carried both an activity-area assignment and a defined sort sequence — conditions SAP expects before LDP can run. Factory calendars were reviewed and correctly assigned so forecasts would reflect real working days.
Phase 3 · Activation of pLDP and the ML scenario (Weeks 5–6)
Activated Labor Demand Planning via the EWM Customizing path (Labor Management → Labor Demand Planning → Activate Labor Demand Planning), which by design also brings the planning side of Labor Management to life. The team then set the intelligent scenario EWM_LDP_FORECAST2_00 to active in the ISLM Fiori app, putting the embedded ML forecast into operation.
Phase 4 · Data validation & forecast calibration (Weeks 7–9)
With three-plus weeks of history in the system, the first forecasts were generated and compared against actuals. The early cycles were honest about their youth: the first two weekly runs under-called end-of-week volumes, and one projection was skewed by a one-off bulk order that had inflated a single day’s history. SCM CHAMPS sat with supervisors in weekly forecast-versus-actual reviews, cleaned the outlier from the learning window, and watched the curve tighten as fresh data accumulated.
By week 9, forecasts were tracking within 14% of actual daily workload (MAPE), improving from ~29% in the first cycles.
Phase 5 · Analytics, training & go-live (Weeks 10–12)
The Smart Business dashboards, the LDP interface, and the Warehouse KPIs forecast cards were rolled out to planners, shift leads, and management, with role-based training on reading FTE projections, expected weights, and volumes and turning them into a shift plan. After go-live came structured hypercare: a 15-minute daily huddle for the first two weeks to compare forecast against actual, easing back to a weekly review once the numbers were clearly holding.
Challenges We Hit — and How We Solved Them
Historical data quality
Early analysis exposed inconsistent confirmation practices in one packing zone, which distorted the workload history. SCM CHAMPS worked with floor supervisors to standardize RF confirmation discipline and excluded the unreliable window from the learning baseline before the first productive forecast.
Skepticism from experienced supervisors
At first the veteran shift leads trusted their own gut over “a number from the system.” So SCM CHAMPS didn’t push. For four weeks it ran the forecast quietly in parallel while supervisors planned their own way. The turn came about halfway through, when the system flagged an unusually heavy Thursday that the manual plan had played down — and that morning’s wave load proved it right. From then on, the question on the floor moved from “why should we trust it?” to “what’s it seeing that we’re not?”
Exceptional demand events
A time-series model learns from patterns, so it can’t foresee a flash sale that has no precedent. The team set a simple rule of thumb: the forecast is the starting point, and planners layer known events on top of it — a promotion, a new client going live. The tool guides the call; the planner still makes it.
Scope expectations
Some stakeholders assumed the forecast would also cover inbound receiving. SCM CHAMPS was clear about the current functional scope — outbound picking, packing, and staging — and positioned inbound on the future roadmap, aligned with SAP’s own release direction.
Before and After
| Before pLDP | After pLDP | |
| Planning basis | Last week’s throughput plus intuition | ML forecast from the warehouse’s own RF history |
| Weekly planning effort | ~6 hours of spreadsheet work | Under 1 hour reviewing a forecast |
| Unplanned overtime | Climbing; last-minute approvals | Down ~18% |
| Productivity (lines / labor hr) | Set by the rear-view mirror | Up ~11% |
| Peak dispatch | Reactive; queues already forming | Staffed to forecast; better on-time |
| Forward visibility | Backward-looking reports only | FTE, weight & volume projected days ahead |
| Labor utilization | Over/under — sometimes the same week | Balanced; imbalance visible before the shift |
The Results
Within the first three months after go-live, the client recorded the following. Figures are client-observed estimates from the initial post-go-live review.
- Weekly labor-planning effort cut from ~6 hours to under 1 hour — freeing supervisors for floor leadership instead of spreadsheet work.
- Unplanned overtime down by an estimated 18%, driven by earlier visibility of upcoming peaks.
- Order lines per labor hour up by an estimated 11% — the productivity measure the client’s finance team watches most closely — as staffing tracked the forecast instead of the rear-view mirror.
- Improved on-time dispatch adherence during peak days, with staffing aligned to forecasted workload rather than reacting to queues already forming.
- Balanced labor utilization across activity areas, with FTE projections making under- and over-allocation visible before the shift, not after.
- No ELS investment required — credible labor planning achieved on historical workload records alone, avoiding a costly labor-standards program.
- A single source of truth — management, planning, and IT all reading the same Smart Business dashboards and KPI cards.
-
Order cut-off adherence improved from 89% to 96% — earlier peak visibility meant shifts were staffed to meet critical dispatch windows.
•	Shift fill rate rose from 85% to 93% — forecast-based shift plans reduced last-minute agency calls and under-coverage.
What the 18% is worth: Against a prior-year unplanned-overtime run rate of €510,000, an ~18% reduction represents roughly €91,800 saved per year.“Earlier, half our arguments were about how many people we’d need. The system settled the big question — now we only argue about the small stuff.”
— Outbound Shift Lead, client distribution center
What Changed on the Floor
Beyond the numbers, the cultural shift mattered most. Sunday-evening guesswork was replaced by a Monday-morning routine of reviewing a forecast rather than creating one. Supervisors stopped defending headcount guesses and started reading a shared signal. The debate moved from “how many people?” to the finer calls about where to place them.
“The best compliment came about a month after hypercare ended: the calls stopped. The forecast wasn’t a project anymore — it was simply how the warehouse ran.”
— Project Lead, SCM CHAMPS
Lessons Learned & Best Practices
- Data discipline comes before intelligence. The forecast is only as good as the RF history behind it. Fix confirmation habits before switching on machine learning.
- Start where the standard is strong. Staying on SAP standard functionality — resisting premature customization — kept the project fast, upgrade-safe, and low-risk. Enhancement options (BAdIs) exist for later.
- Run the forecast in parallel first. A short parallel phase where human plans and system forecasts coexist is the fastest way to earn operational trust — and to catch data issues early.
- Treat the forecast as a baseline, not a verdict. Pattern-based forecasting won’t predict a never-before-seen event. Pair it with planner knowledge of promotions and business changes.
- Mind the prerequisites. Activity-area assignments and sort sequences for packing/staging bins, RF setup, factory calendars — verify them before activation, not after.
- Position the tool honestly. Being clear that today’s pLDP scope is outbound prevented disappointment and built credibility for the roadmap.
The Road Ahead
For the client, Predictive Labor Demand Planning turned labor planning from an anxious weekly ritual into a routine, evidence-based decision. Together, SCM CHAMPS and the client have outlined a phased roadmap:
- Stay current with SAP’s pLDP innovation cycle, adopting future feature packs — including longer-horizon forecasting built on aggregated historical workload data.
- Extend forecasting coverage to additional processes such as inbound and production integration, as SAP broadens pLDP’s functional scope.
- Introduce selective ELS in high-value activity areas, leveraging pLDP’s standard coexistence logic where engineered standards take precedence.
- Connect forecasts to shift scheduling, closing the loop from predicted demand to published rosters.
The destination is a warehouse that doesn’t just react to work — it sees it coming.
Frequently Asked Questions
What is Predictive Labor Demand Planning (pLDP) in SAP EWM?
pLDP is a machine-learning capability embedded in SAP EWM on S/4HANA that forecasts short-term warehouse labor demand from the site’s own warehouse execution history — picking, packing, and staging. It projects workload duration, required FTEs, weight, volume, and item counts for the coming days and the week ahead.
Do you need Engineered Labor Standards (ELS) to use pLDP?
No. pLDP works on historical workload records alone, so warehouses can get AI-driven planning without first building ELS. It remains fully compatible with ELS: any activity area where standards are maintained is governed by those standards, while the rest keep using the ML forecast.
How much historical data does pLDP need before it can forecast?
SAP documents a two-week minimum. In this engagement, SCM CHAMPS insisted on at least three weeks of clean RF data before the first productive run so the model could learn the warehouse’s weekday and volume patterns reliably.
What machine-learning model does pLDP use?
SAP’s published FAQ identifies the underlying method as triple exponential smoothing — a seasonal time-series algorithm — running within the ISLM framework on the Predictive Analysis Library (PAL). It retrains continuously on new execution data, so there is no separate model-training project.
How accurate is pLDP, and does it improve over time?
Accuracy depends on the consistency of the underlying RF history and improves as more execution data accumulates. In this project, early cycles under-called end-of-week volumes and were skewed by a one-off bulk order; once the outlier was removed and fresh data accrued, forecast-versus-actual variance tightened materially over the first few weeks.
Does pLDP cover inbound processes?
As of the release used here (2025 FPS01), pLDP covers outbound picking, packing, and staging. SAP has signalled inbound and production-integration processes as candidates for future releases.
How long does a pLDP implementation take?
This engagement ran 12 weeks end-to-end — discovery and readiness, prerequisite configuration, activation of the ML scenario, data validation and calibration, then analytics, training, and hypercare. Timelines vary with data quality and RF-configuration readiness.
See What Predictive Labor Planning Could Do for You
The shift from reactive to predictive labor planning is no longer a future ambition — it’s running in production. If your warehouse is still setting headcount in a spreadsheet, the move may be closer than you think.
Talk to SCM CHAMPS about a pLDP readiness assessment for your SAP EWM environment — a short review of your RF data, prerequisites, and forecasting potential, with a clear view of the effort and the likely payback.