


Three months after a smooth SAP EWM go-live, a distribution centre I visited was picking 90 order lines per hour. Before the implementation, the same team consistently hit 120. The IT team insisted the system was configured correctly. They were right. The warehouse manager showed me dashboards I would have been proud of six months earlier. But his pickers were walking an extra four miles per shift, and nobody had noticed because the old system never measured travel time at all. The software did its job. It put the problem on a screen for the first time. Nobody acted on what they saw.
In one line: SAP EWM won’t raise productivity by itself. It shows you where the operation loses time — the gains come when slotting, pick paths, and labour planning actually respond to what it measures.
SAP EWM exposes the problems that were always there: bad slotting, outdated pick paths, and undisciplined processes. And now it measures them in real time. Before go-live, a picker walking 200 metres to retrieve a fast-moving SKU was just how things worked. Nobody tracked it. EWM tracks everything, and suddenly the data tells an uncomfortable story. Too many companies confuse “system live” with “operations improved”, then spend months blaming the software for reporting what their warehouse was actually doing all along.
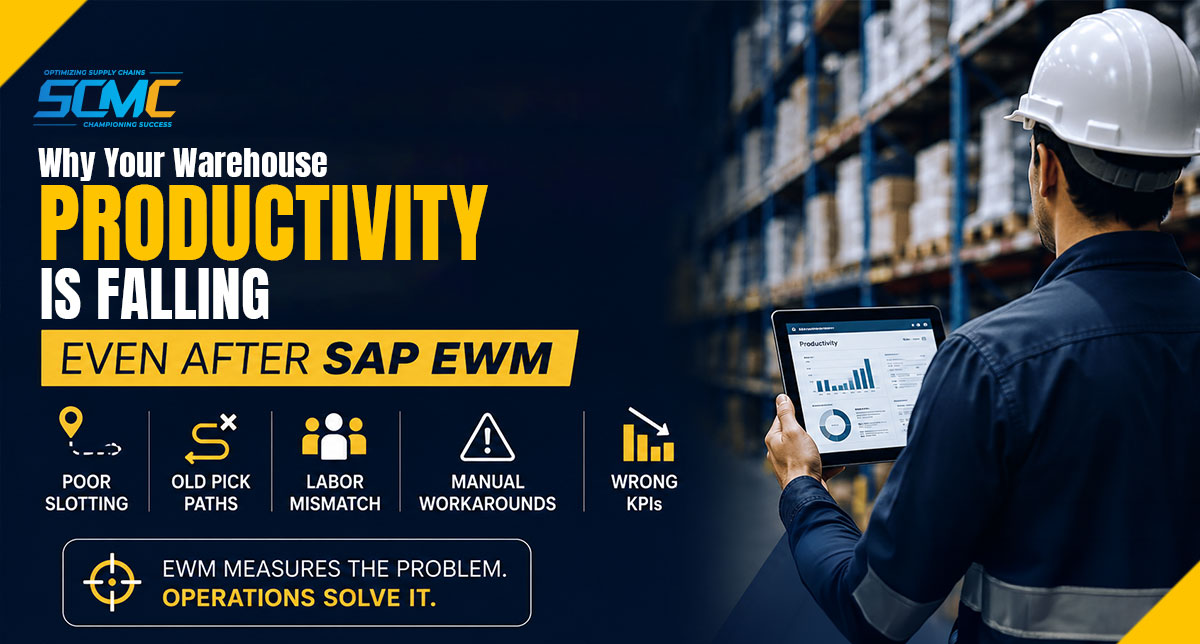
Here are the five reasons productivity falls after go-live and what each one actually costs.
A note on the examples: everything described here comes from real projects. Client names are withheld at their request — only the industries are mentioned.
1. Fast Movers Sitting in the Back Aisles
In one FMCG warehouse, the top 20 SKUs made up 60% of pick volume and sat in the three aisles farthest from the dispatch area. This configuration predated EWM by four years. Nobody questioned it because the old WMS only reported order completion, not travel distance. Once EWM started showing the walking patterns, the math was simple: pickers were spending 55% of their shift just moving between locations. The cost showed up as an extra 22 labor hours per day that the pre-EWM staffing model never budgeted for. Quarterly slotting reviews would have surfaced this in week one of post-go-live analysis, but the operations team was still celebrating a clean cutover.
2. Digitising the Old Workflow Instead of Redesigning It
I keep seeing the same pattern: a warehouse spends months mapping its physical processes into EWM exactly as they existed in the legacy system. The 2015 pick path gets digitised, not rethought. EWM executes it faster, but the route itself is still inefficient. The business case for EWM assumed a 25% pick-rate improvement. When the actual number landed at 7%, the steering committee blamed the software. The software ran the route it was given. The fix is unglamorous: walk the physical path with a stopwatch before configuring the system path. A supervisor can map a better route in two hours. That two hours is often the difference between hitting the business case and quietly abandoning it.
3. Labour Planning Frozen in Time
After EWM, the work moves around. Tasks consolidate, priorities shift, and some zones suddenly carry more volume than they used to. One distribution centre I reviewed was still staffing its picking and packing zones based on a 2019 spreadsheet. EWM data showed packing was overstaffed by three people after lunch while picking was short by four. The result: overtime in one zone, idle time thirty metres away, and a supervisor manually reallocating people by shouting across the floor. Fixing this doesn’t need a project. EWM already shows workload by work centre in real time. A monthly labour rebalance using actual task volumes closes this gap without any system change.
4. Exceptions That Become the Real Process
Operators bypass the system for “exceptions”, and slowly the exceptions become the norm. I watched a picker skip a system-directed putaway because the bin was full, write the location on a sticky note, and keep going. Three other pickers had done the same thing that morning. Nobody was keeping track of how often this was happening. Within eight weeks of go live, inventory accuracy had dropped to 94%. That meant more cycle counts, which were pulling experienced pickers off the floor for half a shift every week. Track exception frequency weekly. Every recurring exception is a broken process wearing a “one-time workaround” disguise. When the same exception appears three weeks running, it’s not an exception anymore.
5. Measuring the Wrong KPIs
Most post-go-live steering committee decks I see celebrate orders shipped and lines completed. Those are output metrics. Productivity metrics tell a different story: travel time per order, touches per order line, and lines picked per labour hour. EWM reports them all. Measure the wrong thing and leadership sees green dashboards while operating cost per order rises 12% in the background. One operation I reviewed hit every daily order target for six straight months, while unit picking cost quietly increased because travel time never made it into the monthly review. Shifting KPI reviews from output to productivity metrics takes one meeting to decide and about four weeks of data to make permanent.
What High-Performing Warehouses Do Differently
What high-performing warehouses do differently isn’t complicated, and none of it requires another IT project:
- Supervisors walk pick paths once a month with a stopwatch.
- Slotting gets reviewed every quarter against actual velocity data from EWM, not against someone’s memory of what sells.
- Exception logs are reviewed weekly — any exception recurring three times becomes a process redesign task.
- KPI decks include travel time and touches per order, not just orders completed.
- Labor gets rebalanced against task volume data every season.
The warehouses that sustain their go-live gains treat EWM as an operational tool, not an IT asset. The ones that don’t keep wondering why the expensive new system “didn’t deliver”.
A Real Example: Three DCs, Zero Configuration Changes
A consumer goods company we worked with went live with EWM across three DCs in 2022. The implementation was technically clean. Six months in, pick rates were flat and overtime was 18% above plan. When our team walked the floor, we found slotting hadn’t been touched since cutover. Seasonal volume shifts had pushed fast movers into upper racking while slow movers sat in gold-zone pick faces. Pick paths were the same routes the legacy system used. Operators had developed five different workarounds for an exception the system flagged correctly but nobody had fixed. Over four months we rebuilt the slotting logic against actual velocity data, redesigned pick paths based on physical walk measurement, and eliminated four of the five workarounds through process changes rather than system changes. Pick productivity improved roughly 18–20%. The interesting part: we made exactly zero EWM configuration changes. The system was working properly from day one. The operation simply was not aligned with what the system was now measuring.
Important Conclusion
Once the project goes live, the real work begins.
Automation will speed up a weak process, but it won’t make the process better.
Productivity is shaped by things like slotting, travel paths, labour planning and day-to-day discipline, not just system configuration.
And if your KPIs are looking good but costs are still going up, you may be looking at the wrong parameters.
FAQ’s
Why did productivity drop after our SAP EWM go-live?
In most cases the software isn’t the problem — the operation hasn’t caught up with what the system now measures. The usual suspects: slotting nobody has touched since go-live, old pick paths copied straight into the new system, labour plans built on pre-EWM assumptions, workarounds that quietly became the real process, and KPI reviews that only look at orders shipped.
Does SAP EWM improve picking productivity by itself?
No. SAP EWM measures and directs work — it doesn’t fix slotting, routes, or discipline on its own. The productivity gains come when the operation acts on the data: quarterly slotting reviews against velocity data, pick paths redesigned from physical walk measurements, and monthly labour rebalancing. In one engagement, simple operational changes improved pick productivity by 18 to 20% without changing the system configuration.
So, which KPIs to monitor after SAP EWM goes live?
The warehouse is moving product, but the question is how much and where the cost is going. Look at travel time per order, touches per order line, lines picked per labour hour, weekly exception counts and inventory accuracy. Orders shipped and lines completed tell you the warehouse is busy; they don’t tell you what each order costs. EWM reports all of these — most operations just never put them in the monthly review.
How long does it take to recover warehouse productivity after go-live?
Faster than most teams expect, because the fixes are operational, not technical. Individual fixes are quick — a supervisor can map a better pick path in two hours, and a KPI reset takes one meeting plus about four weeks of data. A full recovery programme across slotting, paths, labour, and exceptions typically runs three to four months, based on our project experience.
About SCM Champs
SCM Champs is an official SAP partner focused on post-implementation performance. We work with organisations whose warehouse operations haven’t matched their technology investment — resolving the full range of EWM-related operational and process issues, from slotting and labour productivity to exception reduction and execution discipline. Our team has delivered major projects across North America and Europe. We don’t reimplement systems. We make the operation worthy of the one you already paid for.