


Introduction
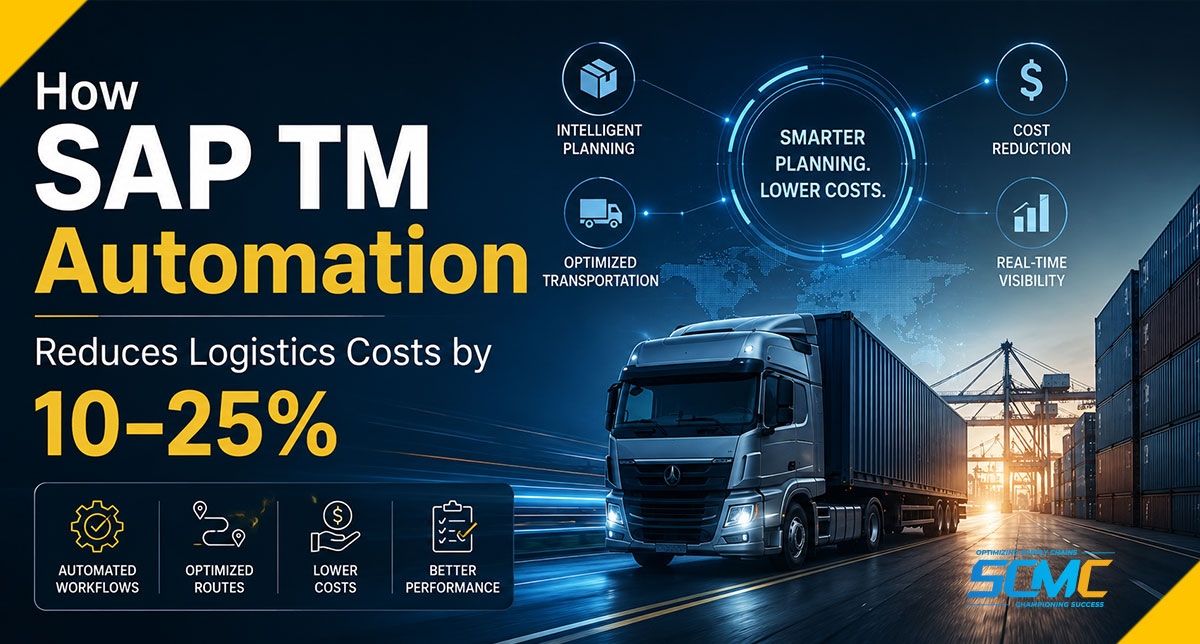
You’ve probably seen the claim before: SAP TM automation can cut transportation costs by 10–25%. It shows up in vendor decks, consulting proposals, and articles like this one. Fair question — where does that number actually come from?
Most content states it and moves on. This article does the opposite. I’m going to break the number down lever by lever, give you a simple way to estimate where your own organization would land in that range, and show you what it looked like on a real project.
This is written for logistics directors, supply chain leaders, and SAP program owners anyone who needs to put a defensible number in front of a CFO, not just a slogan.
One note before we start: if you’re still at the earlier stage SAP is live, costs are high, and you’re not sure why — start with [the 5 hidden gaps that keep transportation costs high after SAP implementation]. That article covers the diagnosis. This one covers what fixing it is worth.
Where the 10–25% Actually Comes From
There’s no single switch that delivers a 20% saving. The number is a stack — five levers, each contributing its share. In the SAP TM optimization projects I’ve worked on, the contributions typically look like this:
| Savings Lever | What Automation Changes | Typical Contribution* |
|---|---|---|
| Load consolidation | The optimizer merges compatible shipments; trucks stop leaving below capacity and needless LTL moves disappear | 4–10 percentage points |
| Route optimization | System-proposed routes instead of planner habit | 2–5 percentage points |
| Carrier rate optimization / tendering | Rule-based carrier selection and cost ranking instead of habitual assignment | 2–6 percentage points |
| Reduced planning errors & rework | Fewer manual touches means fewer re-plans, expedites, and penalties | 1–2 percentage points |
| Settlement leakage recovery | Automated freight settlement catches billing discrepancies before they’re paid | 1–3 percentage points |
*Illustrative ranges based on our SAP TM optimization project experience. Actual results vary with freight spend, network structure, planning maturity, and system configuration.
Two things are worth noticing in this table. First, consolidation is almost always the largest lever — which is why organizations shipping heavy LTL volumes tend to sit at the upper end of the overall range. Second, the smaller levers are not decoration. One or two percentage points of settlement leakage on a large freight spend is real money, recovered quietly, every single month.
Now, the insight that separates a good optimization project from a mediocre one: the order of these fixes matters. Consolidation savings depend on freight unit building rules being fixed first. Freight units created too early, with broad default rules, lock shipments into shapes the optimizer can’t recombine later. Automate carrier selection on top of badly built freight units and you’ve just optimized the wrong thing very efficiently.
Why this doesn’t happen on its own: identifying the levers is the easy part; pulling them is where organizations get stuck. The typical story is one we examined in depth in [the previous article] — settings that never moved past their go-live state, an optimization roadmap that ended when the project team disbanded, and old planning routines that quietly outlived the new system.
Estimate Your Own Number
Industry ranges are a starting point, not an answer. Here’s the simple framework I use in first conversations to estimate where an organization will land — three inputs, in this order:
1. Annual freight spend. This is the base everything is calculated on. A 12% saving means very different things at $5 million and at $50 million of freight spend.
2. How manual is planning today? Be honest here. If the working day begins with shipment data being pulled out of SAP and into spreadsheets, you’re realistically at the high end of the 10–25% range. If it’s partially automated, the middle. If the optimizer is already doing most of the work, the low end; your remaining gains come from tuning, not transformation.
3. Network complexity. A simple network — single site, a handful of carriers — offers less consolidation upside. A complex one — multiple plants or distribution centers, a mixed LTL/FTL profile, many contracted carriers — offers more, because there are simply more combinations the optimizer can exploit that a human planner can’t evaluate under time pressure.
Put those together and the math gets concrete quickly. Take an organization spending $20 million annually on freight, planning primarily in spreadsheets, across multiple distribution centers with a heavy LTL mix. That profile would realistically sit toward the upper end of the overall 10–25% range. And here’s the part worth pausing on: even the very bottom of that range is $2 million a year — comfortably more than what fixing the gaps typically costs, because most of the fixes are configuration work inside a system that’s already licensed and running.
This is an estimate framework, not a guarantee. Our assessment exists precisely to replace this estimate with your actual numbers.
What Waiting Another Year Actually Costs
Here’s the uncomfortable flip side of the same math. If your organization sits somewhere in that 10–25% range, then every quarter of manual planning has a price tag — you just never see the invoice.
Unrealized savings don’t show up in any budget review. The freight bill gets paid, the planners stay busy, and everything looks like normal operations. Nobody approves a line item called “money we chose not to save.” That’s precisely why manual planning survives year after year: its cost is invisible while its familiarity is comfortable.
Run your own freight spend against even the bottom of the range, divide by four, and that’s roughly what one more quarter of deferral costs. For most organizations I’ve worked with, that number ends the “is this worth looking at?” debate on its own.
What Is SAP TM Automation and How Does It Work?
SAP TM automation is the use of intelligent rules and optimization logic within SAP Transportation Management to plan shipments, select carriers, and manage execution and settlement automatically — reserving planner involvement for the exceptions that genuinely require a decision.
It works across three layers.
Planning automation starts with freight unit building rules, which convert orders or deliveries into plannable freight units automatically. The VSR optimizer then proposes consolidated loads and routes, guided by planning profiles tuned to your network, fleet constraints, and delivery priorities.
Execution automation covers carrier selection and tendering — using configured business rules such as allocations, business shares, or cost-based ranking — plus event management for real-time shipment tracking.
Settlement automation calculates expected freight costs against contracted rates and flags discrepancies before invoices are paid.
A concrete example of the difference this makes: in a manually planned operation, a planner assigning 100 shipments picks carriers and builds loads one at a time, based on experience. An automated setup evaluates all 100 together, finds the consolidation opportunities across them, and assigns carriers by contract logic — in minutes, repeatably, without depending on who’s planning that day.
For the deeper explanation of each capability, see [the detailed automation section in our previous article]. For this piece, the essential point is simpler: the technology is standard SAP TM. The savings come from configuring and actually using it.
A Scenario From Project Experience
A mid-sized consumer goods distributor, supplying retail chains and wholesale customers through three distribution centers, was working with around 18 contracted carriers on a mixed LTL and FTL network — several thousand shipments a month, primarily domestic.
SAP TM was live. But planning relied heavily on individual planner decisions. Carrier assignment followed planner preference rather than cost or contract rules. Consolidation opportunities were missed week after week, producing a steady stream of unnecessary LTL shipments. And underneath it all, the freight unit building parameters had never been optimized — which meant the planning optimizer couldn’t do much even when it was used.
Notice the pattern: this is the fix-ordering point from earlier, playing out in practice. The consolidation problem couldn’t be solved by better carrier selection alone, because the freight units themselves were the constraint.
So that’s where the work started. We reviewed and optimized the freight unit building rules, refined the planning profiles, implemented rule-based carrier selection aligned with contracted rates, improved the tendering configuration, and adjusted optimization parameters to favor consolidation.
The result was approximately 14% transportation cost reduction within nine months. Just as importantly, transportation planning became far more consistent because planners no longer relied on manual carrier selection and individual judgment for routine decisions. No new software was purchased. The system they already owned simply started doing the job it had been configured to do — this time with planning rules, carrier selection, and optimization settings aligned to the business’s transportation network.
Against the framework above, this outcome is exactly where you’d expect it: a complex multi-DC network with heavy manual planning, landing solidly in the middle of the 10–25% range.
Is This Relevant for Your Organization?
A quick way to qualify whether this math deserves your attention:
- Your annual freight spend is large enough that even a 10% reduction is a board-level number.
- Load and carrier decisions still come from whoever is planning that day, not from configured business rules.
- You run SAP — TM, ECC, or S/4HANA — but the setup hasn’t been revisited since it went live.
- Shipment volumes are growing faster than your planning team.
If two or more of those apply, the estimation framework above is worth running with your real numbers.
What Data Do You Need to Build a Reliable Business Case?
If you’re preparing to make this case internally, gather these inputs first — they’re what any credible savings calculation is built on:
- Annual freight spend, ideally split by mode
- Monthly shipment volumes and their seasonality
- Carrier mix — how many carriers, and how they’re currently assigned
- LTL vs. FTL ratio — the single best indicator of consolidation upside
- Number of shipping locations — plants, DCs, warehouses
- How planning happens today — system-driven, spreadsheet-driven, or somewhere between
- Your current SAP landscape — standalone TM, ECC, or S/4HANA with embedded TM
You don’t need perfect data. Even rough figures for these seven items are enough to turn “we should look into this” into a numbers-based conversation your CFO can engage with. And practically speaking, gathering and analyzing exactly this data is the first thing a structured assessment does.
How We Turn the Estimate Into a Business Case
When SCM CHAMPS runs this analysis, the deliverable is deliberately narrow: the three figures a finance leader will demand before approving anything. First, what today’s process is leaking — calculated from your shipment history, not assumptions. Second, the savings range you can actually reach, derived from your network structure, planning maturity, and freight profile rather than an industry average. Third, a ranked list of fixes, each scored by implementation effort against expected return, so the sequence of work is obvious.
Everything in that business case traces back to your data. In my experience, that traceability not the size of the number is what moves a proposal from ‘interesting’ to ‘approved.
Frequently Asked Questions
How is the ROI of SAP TM automation calculated?
By comparing the savings across the five levers — consolidation, routing, carrier rates, error reduction, and settlement recovery — against the cost of enabling them. For organizations already licensed on SAP TM, most of that cost is configuration and expertise, not new software, which is why the ROI math tends to be favorable.
Which savings lever delivers results fastest?
Typically carrier selection and tendering rules — they’re quick to configure and the impact shows up on the very next tendering cycle. Consolidation takes longer to enable but is usually the bigger prize.
Is 10–25% realistic for smaller shipment volumes?
The percentage generally holds, but the absolute savings scale with freight spend. Below a certain volume, the honest advice is to prioritize the quick wins — tendering rules, settlement checks — where the effort is small enough that even modest absolute savings justify it.
What is the typical payback period?
For organizations with meaningful transportation spend and clear optimization opportunities, these projects often recover their investment within the first year. The actual period depends on freight spend, shipment volume, and how much of the optimization scope is implemented.
Ready to Replace the Estimate With Your Real Number?
Everything in this article gets you to a range. Only your own shipment data gets you to a number — one shaped by what you spend on freight, how your network is built, and how much of today’s planning still runs on habit.
That’s what SCM CHAMPS complimentary review delivers: the leakage in your current process, the savings genuinely within reach, and a ranked sequence of fixes to capture them — all calculated from your figures, not ours.
Schedule your complimentary SAP TM review — and turn the 10–25% range into the one number that matters: yours.